Food Cost Percentage: How to Calculate It Weekly (and What’s Normal)
How to calculate food cost percentage every week from a stock count: the formula, euro examples, VAT, actual vs ideal food cost and what's normal for your venue.
On this page
- What is food cost percentage?
- How to calculate food cost percentage weekly, step by step
- Should food cost percentage be calculated with or without VAT?
- What is a normal food cost percentage?
- Actual vs ideal food cost: what does the gap tell you?
- What to do when your food cost percentage is too high
- How do you know your weekly food cost number is right?
- Common food cost percentage mistakes
- FAQ: food cost percentage
- Turn your weekly number into better prices
Your weekly food cost percentage is (opening stock + purchases − closing stock) ÷ net food sales × 100. Count your food stock at the same time every week, add the invoices delivered in between, subtract what is left on the shelves, and divide by food sales without VAT. Most restaurants land somewhere around 28–35%; this guide shows how to get a number you can trust, what’s normal for your type of venue, and what the gap to your “ideal” food cost tells you.
Short answer: A trattoria starts the week with €3,850 of food in stock, buys €4,120 (net of VAT) and counts €3,640 on Sunday night. After taking out €60 of lemons sent to the bar and €150 of staff meals, it used €4,120 of food. Food takings were €14,850 including 10% VAT, which is €13,500 net. €4,120 ÷ €13,500 = 30.5% food cost for the week.
- Food used (cost of goods sold) = opening stock + purchases − closing stock − transfers out − staff meals
- Net food sales = food takings incl. VAT ÷ (1 + VAT rate)
- Actual food cost % = food used ÷ net food sales × 100
- Ideal food cost % = Σ (portions sold × plate cost) ÷ net food sales × 100
- Variance in € = (actual % − ideal %) × net food sales
What is food cost percentage?
Food cost percentage is the share of your net food sales that you spent on the food you used in the same period. It is the kitchen-wide version of the per-dish figure you use for pricing: one plate’s cost ÷ its price tells you whether a dish is priced right (see how to price menu items), while the weekly figure tells you whether the whole kitchen is actually running at that level once waste, portions and price rises are counted.
Keep drinks out of it. Drinks have their own, usually lower, cost percentage and often a different VAT rate, so mixing them in hides problems on both sides. Track a separate pour cost for the bar, as explained in how to price drinks.
How to calculate food cost percentage weekly, step by step
A weekly food cost needs six things: a fixed count time, last week’s closing count, this week’s invoices, a new closing count, a few adjustments and the net food sales from your till.
Step 1: Fix the count day and time
Count at the same moment every week, for example Sunday after close or Monday before the first delivery. If you count before a delivery one week and after it the next, the number swings by the value of that delivery and means nothing.
Step 2: Take opening stock from last week’s closing count
This week’s opening stock is simply last week’s closing stock, so you only count once a week. Value it at the price on your latest invoice, net of VAT, and use a count sheet printed in the order the shelves are arranged (walk-in, freezer, dry store) so nothing gets skipped.
Step 3: Add the week’s food purchases
Add every food invoice for goods delivered between the two counts, net of VAT and minus any credit notes. Delivered is what matters, not paid: an invoice that arrives on Tuesday for Saturday’s fish belongs to last week.
Step 4: Count closing stock
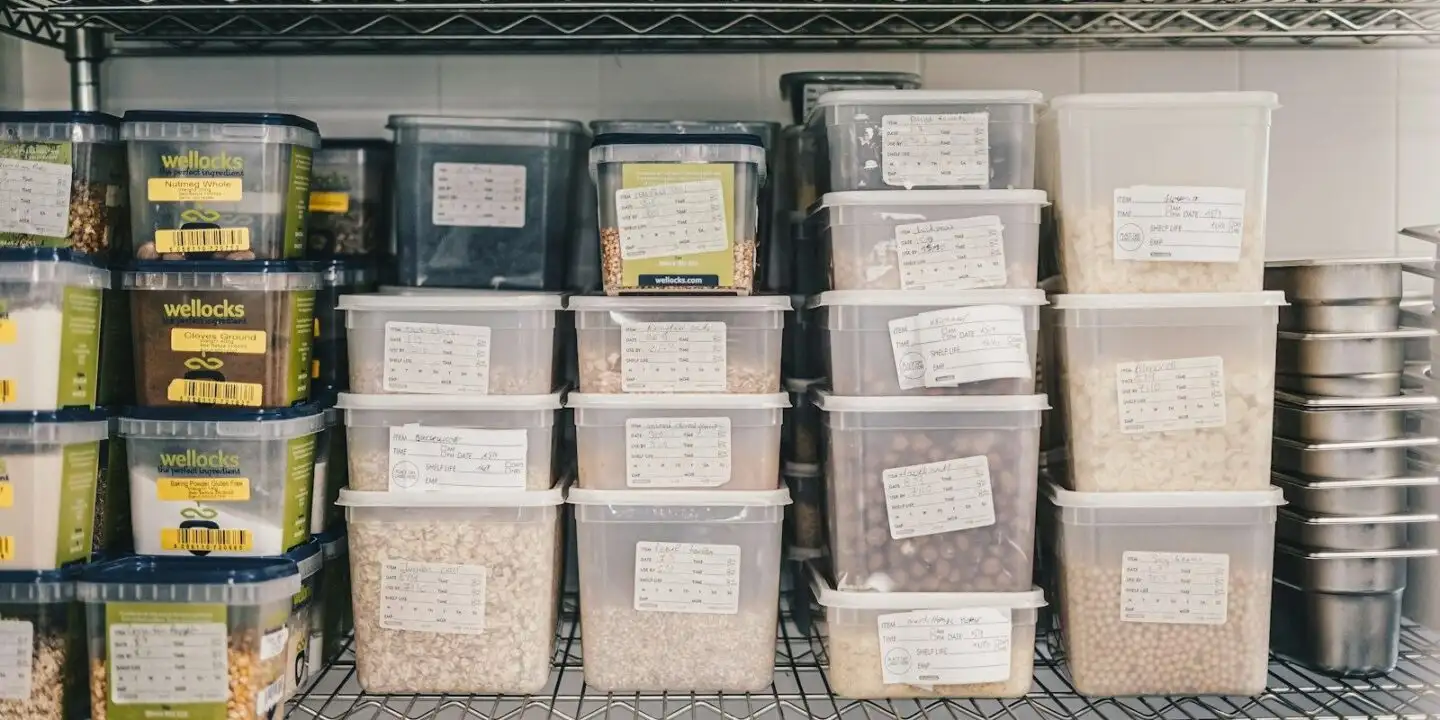
Count everything that’s left, including opened packs, prepped sauces and dough in the fridge. Expensive items (meat, fish, cheese, olive oil) deserve a careful count; a rough estimate is fine for salt and dried herbs.
Step 5: Take out transfers and staff meals
Subtract food that left the kitchen without being sold as food: lemons, mint and cream sent to the bar, and staff meals if you record those as a staff cost. Whatever you decide, do it the same way every week.
Step 6: Divide by net food sales
Take food sales for the same days from your till, remove VAT, and divide. Here is the trattoria from the short answer laid out as a weekly sheet (illustrative figures):
| Line | Amount |
|---|---|
| Opening stock (last Sunday’s count) | €3,850 |
| + Food purchases delivered this week (net) | €4,120 |
| − Closing stock (this Sunday’s count) | €3,640 |
| − Transfers to the bar | €60 |
| − Staff meals | €150 |
| = Food used | €4,120 |
| Food takings incl. 10% VAT | €14,850 |
| Net food sales (€14,850 ÷ 1.10) | €13,500 |
| Food cost % | 30.5% |
Should food cost percentage be calculated with or without VAT?
Always calculate food cost percentage on sales without VAT, and on purchases without VAT, because VAT is not your money. Using VAT-inclusive takings makes your food cost look better than it is, and the higher the rate, the bigger the error. A second example, a small café in Germany (illustrative): food used €2,450, food takings €9,630 including 7% VAT, so €9,000 net. The real food cost is 27.2%; on gross takings it would look like 25.4%.
| Food used | Takings incl. VAT | VAT rate | Net sales | Real food cost | Wrong (on gross) |
|---|---|---|---|---|---|
| €2,450 | €9,630 | 7% (Germany) | €9,000 | 27.2% | 25.4% |
| €4,120 | €14,850 | 10% (Italy) | €13,500 | 30.5% | 27.7% |
| €3,000 | €12,500 | 25% (Norway) | €10,000 | 30.0% | 24.0% |
Use your country’s rate for food eaten in, and split takeaway sales out if they’re taxed differently:
- Italy: 10% on food and drink served on the premises (somministrazione); goods simply sold to take away are taxed item by item, at up to 22% (Informazione Fiscale).
- Germany: 7% on restaurant food from 1 January 2026; drinks stay at 19% (IHK Frankfurt).
- Netherlands: 9% on meals and non-alcoholic drinks, 21% on alcohol (MKB Servicedesk).
- Norway: 25% on food served on the premises, 15% on takeaway food, 25% on alcohol (Skatteetaten).
- Turkey: 10% on food and non-alcoholic drinks in restaurants and cafés, 20% on alcohol (NTV).
Service charges and tips are not food sales, so leave them out. A cover charge, such as the Italian coperto, can go either way; just treat it the same way every week.
What is a normal food cost percentage?
A normal food cost percentage for a full-service restaurant is roughly 28–35% of net food sales, lower for pizzerias and higher for premium meat and fish. Lightspeed says “most UK restaurants aim for a food cost of 28–35%” (Lightspeed). Toast reports National Restaurant Association medians for 2024 of 32.0% for full-service and 32.4% for limited-service restaurants, for food and non-alcoholic drinks in the US (Toast). Dutch costing tool KitchenNmbrs gives ranges by venue type (KitchenNmbrs):
| Type of venue | Typical food cost |
|---|---|
| Pizzeria | 20–28% |
| Fast casual | 25–30% |
| Bistro / brasserie | 25–32% |
| Café food | 25–35% |
| Casual dining | 28–35% |
| Fine dining | 28–35% |
Your number can sit above the range and still be healthy if your dishes earn a lot of cash per plate, your rent is low or you run a lean team; it can sit below and still hurt if labour eats the difference. The best benchmark is your own ideal food cost, which comes next. How food cost fits with labour and rent in the bottom line is covered in restaurant profit margin.
Actual vs ideal food cost: what does the gap tell you?
The gap between actual and ideal food cost is the food you paid for but didn’t sell, and it is the single most useful number in this whole routine. Ideal (or theoretical) food cost is what you would have spent if every dish sold had been made exactly to its recipe card: portions sold × plate cost, divided by net food sales. You need costed recipe cards for this; recipe costing shows how to build them.
An illustrative three-dish example, with Italian prices including 10% VAT:
| Dish | Sold | Plate cost | Menu price | Food cost (ideal) | Net sales |
|---|---|---|---|---|---|
| Margherita pizza | 420 | €1.64 | €7.50 | €688.80 | €2,863.64 |
| Spaghetti carbonara | 260 | €2.30 | €13.00 | €598.00 | €3,072.73 |
| Tagliata di manzo | 140 | €8.50 | €23.00 | €1,190.00 | €2,927.27 |
| Total | €2,476.80 | €8,863.64 |
Ideal food cost = €2,476.80 ÷ €8,863.64 = 27.9%. Weight it by what actually sold, as here; a simple average of each dish’s percentage is wrong as soon as the mix changes.
Back to the trattoria: if its recipe cards and till mix give an ideal of 28.0% and the count says 30.5%, the 2.5-point gap is worth €337.50 a week on €13,500 of sales, or about €17,500 a year. Toast lists the usual causes when actual runs above ideal: “waste, overportioning, unrecorded food, inaccurate recipes, or changing supplier prices” (Toast). A gap of a point or so is normal; a growing gap is what to chase.
What to do when your food cost percentage is too high
When food cost runs high, fix the gap to ideal first and the prices second, because a price rise won’t cure waste or heavy portions. Check portion weights on the two or three dishes that sell most, look at the waste log, and compare this week’s invoice prices with the ones on your recipe cards. If the recipe cards are right and the ideal itself is too high, then it’s a pricing or menu problem.
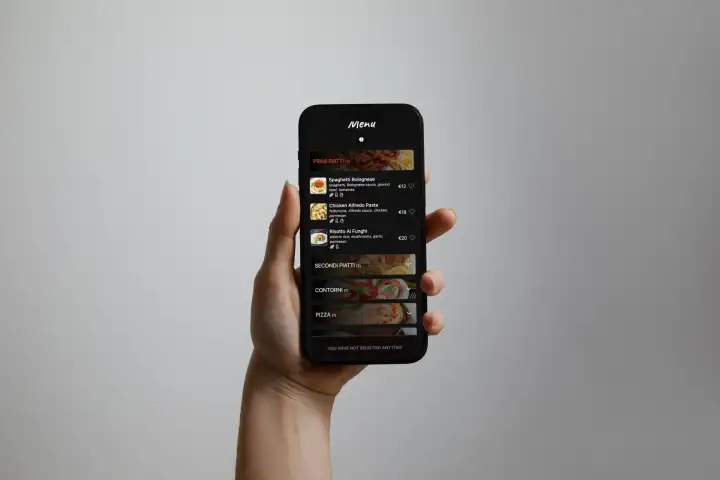
That last step is where a digital menu helps. With Elegant Menu, the QR menu and ordering platform, you change a price online and every guest who scans sees it at once, with nothing to reprint; you can also hide a dish while its main ingredient is too expensive. On paid plans the order analytics show which dishes sell, which is the product mix you need for your ideal food cost, and the menu assistant can apply a change like “raise all pasta prices by 4%” across a section, with each change waiting for your approval.

How do you know your weekly food cost number is right?
A weekly food cost is right when it moves in line with the last few weeks and with your ideal, and any jump can be traced to a real event. Single weeks are noisy because a big delivery on Saturday or a half-counted freezer moves the result. The table shows how much one input, the closing count, moves the trattoria’s result:
| Closing stock counted | Food used | Food cost % |
|---|---|---|
| €3,340 (€300 missed) | €4,420 | 32.7% |
| €3,640 (correct) | €4,120 | 30.5% |
| €3,940 (€300 counted twice) | €3,820 | 28.3% |
A €300 counting error, one case of beef, moves the result by more than 2 points. So before you act on a bad week:
- Check that every invoice is in the week it was delivered, and that credit notes are included.
- Recount the five most valuable items before you trust a big swing.
- Look at a rolling four weeks: total food used ÷ total net food sales over four weeks, not the average of four percentages.
- Compare your monthly total with the food cost your accountant reports; the two should be close.
Common food cost percentage mistakes
Most wrong food cost numbers come from timing and consistency, not from the maths.
- Using purchases instead of food used. Purchases ÷ sales without a stock count swings with every big order.
- Dividing by VAT-inclusive takings. It flatters the result by the VAT rate: 6 points at 25%.
- Counting at different times. Before the delivery one week, after it the next.
- Mixing food and drinks. A busy bar week makes the kitchen look better than it is.
- Forgetting transfers and staff meals. Food that wasn’t sold as food inflates the kitchen’s figure.
- Valuing stock at old prices. Use the latest invoice price, or a rising market hides inside your stock value.
FAQ: food cost percentage
How do you calculate food cost percentage?
Divide the cost of the food you used (opening stock + purchases − closing stock) by net food sales for the same period and multiply by 100. €4,120 of food used on €13,500 of net sales is 30.5%.
How often should I calculate food cost?
Weekly if you can, monthly at the very least. Lightspeed advises weekly for “fresh, high-volume or fast-changing menus” (Lightspeed), because you see a portion or supplier problem within days instead of at month end.
What is a good food cost percentage for a restaurant?
Around 28–35% of net food sales is the common range for full-service restaurants, with pizzerias often at 20–28%. A figure close to your own ideal food cost matters more than any industry average.
What is the difference between actual and ideal food cost?
Actual food cost comes from your stock count; ideal food cost is what the same sales would have cost if every plate followed its recipe card. The difference is waste, over-portioning, unrecorded food or out-of-date costs.
Do I include staff meals in food cost?
You can do either, as long as you do it the same way every week. Many owners subtract staff meals from food cost and book them as a staff cost, so the kitchen figure reflects only food served to guests.
Turn your weekly number into better prices
When the weekly count says a dish costs too much, change its price or take it off the menu the same day. Elegant Menu is free to start, and you can update prices from your phone without reprinting.


Comments